
InSight

Market InSights:

There Is Too Much Money

You read that right, there is simply too much cash in the capital markets to not see a handful of effects that could impact your investments and plan. The supply of money floating around is massive right now. There is a lot of risk, COVID has us concerned about the economics of the coming year, but it’s getting harder and harder to ignore how much cash has been made available.

Even relative to itself, it’s a volume of cash in the money supply that will take at least a decade to settle into long term investments, or be recaptured by the Fed. At the beginning of the year there was roughly $15T in circulation held in cash and cash equivalents. We are in December and the number is closer to $19T of more highly liquid cash in the world. This $4T expansion in only 12 months is remarkable.

Here’s some history on money supply. It took until 1997 to reach the first $4T in circulation, the decade from 2009 to 2019 saw that supply double from $8T to almost $16T (the fastest doubling ever), resulting in a major part of the expansion of the stock market for that decade. Now, in twelve months we have seen a flood of almost 27% more money in the supply than there was at the beginning of the COVID-19 pandemic. 
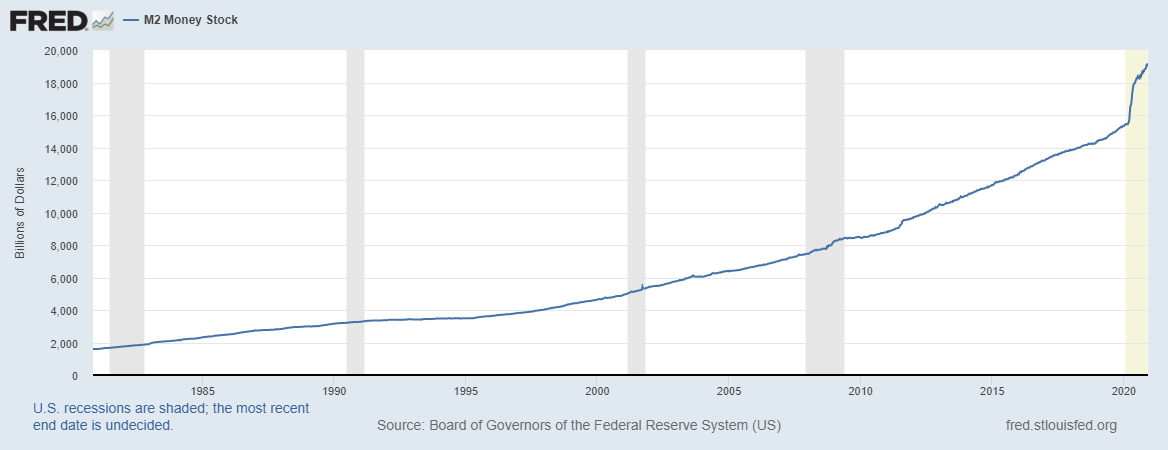
One of the best leading indicators for where capital markets are headed, can be found in how much money, especially highly liquid money like cash, is available in the system. This is a reflection of how big the pie is. Usually in investments we are focused on cash flow, and a companies market share – or how effective a company is at capturing cash flow from a given size of market. That’s becoming less relevant as the sheer volume of cash has exploded. The pie is so big right now that there will have to be a a few notable adjustments to make:

InflationWhile I have heard that Jerome Powell has not registered an increase in inflation yet, it is hard to believe that as the newly introduced money will not have an expansive effect on the costs of goods and services. Many mark the inflation rate off the CPI, grievances with that benchmark aside, it would be irresponsible to assume that the basket of securities they mark to market does not see an above average increase as more money finds its way into the same number of consumer goods. Additionally, elements like rents will see a disproportionate increase in the coming decade because while supply of say consumer goods will increase quickly to capture this cash, construction of rental properties is a less reactive market and a slower roll out to correct the market. In the meantime expect rental costs and revenues to see above average inflation figures. 

Interest Rates – Permanently impaired. As I write this the current observation, the 10 year US Treasury is paying 0.9%, a third of where it was even 2 years ago. It is heard to believe that such a robust introduction of cash doesn’t become a permanent downward pressure on fixed income assets for the foreseeable future. Unless there is a formal and aggressive contraction of the money supply, it will take decades for the amount of cash in circulation to let up that downward pressure on bonds. Interest rates in short term assets will be particularly affected as the demand has become less appetizing in contrast to long term debt, and the supply of cash is chasing too small of demand. 

EquitiesThe real benefactor here. It is hard not to believe that over the course of the coming decade, this cash infusion doesn’t trickle its way up and into the stock market and other asset values. Generally the most “risky” part of the market is the historically the benefactor of excesses in cash. Companies will do what they do best and capture this supply of cash through normal operations, this will expand their revenues and ultimately the bottom line. Additionally, the compressed borrowing costs from low interest rates will lower their operating costs. Compound the poor risk reward ratio in bonds and you will see more of those investments seek out stocks, real estate, and other capital assets. This sector will see a virtuous combination of more revenue, and more demand for shares. Expect permanently elevated P/E reads for the time being. 


More related articles:

boulder investment management, tax planning, k-1, real estate
Articles
Kevin Taylor

How to read a K-1?

Welcome to the exciting world of K-1 forms! Okay, let’s be honest, K-1 forms may not be the most thrilling topic, but understanding them can save you some serious tax headaches. In this blog post, we’ll break down everything you need to know to read your K-1 form like a pro. Whether you’re a seasoned investor or a first-time partner, we’ve got you covered. So, put on your reading glasses, and let’s get started! Reading a K-1 form can be complicated, but here are some steps to help you understand the information provided: Understand the entity type: The K-1 form will indicate whether the entity is a partnership, S-corporation, or LLC. Each entity type has different rules for tax reporting, so it’s important to know what type of entity you are dealing with. Identify your personal information: The K-1 form will include your personal information, such as your name, address, and identification numbers. Make sure this information is correct. Review the income section: The K-1 form will report your share of the entity’s income. Look for the “Income” section of the form and review the amounts in each box. These amounts will need to be reported on your tax return. Review the deductions section: The K-1 form will report your share of the entity’s deductions. Look for the “Deductions” section of the form and review the amounts in each box. These amounts will also need to be reported on your tax return. Review the credits section: The K-1 form may report any credits you are entitled to, such as foreign tax credits or energy credits. Look for the “Credits” section of the form and review the amounts in each box. These amounts will be used to reduce your tax liability. Look for any other information: The K-1 form may include other information, such as capital account balances, distributions, or other items. Make sure you review all sections of the form to ensure you are reporting all necessary information on your tax return. Seek professional help if necessary: If you are unsure about how to read or use the information on the K-1 form, seek help from a tax professional. They can help you understand the information and ensure you are reporting everything correctly on your tax return. In summary, to read a K-1 form, you should identify the entity type, review your personal information, and review the income, deductions, and credits sections. Look for any other important information and seek professional help if necessary.

Read More »
Inflation
Articles
Kevin Taylor

Four Things That Actually Matter With Inflation

Inflation is simply the rising costs of goods and services over time. It’s an important part of the planning process to make assumptions about buying power over time. It allows you to know how to budget your money using a placeholder that should represent to some academic degree the effectiveness of your dollar as you get closer to the time you need it. However, I have had several discussions with clients who assume the incline of inflation is something like 2% annually. And while that is a reasonable, and likely adequate initial placeholder, if your financial advisor is simply using that number because the talking heads on TV or the software they use have that number already baked in, then you need to have a serious discussion about the gaps that arise from such short cutting. A miss on the inflation discussion has two permanent repercussions on your financial plan: Inflation assesses its toll further and further into plans. It’s insidious and you won’t know the impact until the end of retirement, when you have fewer resources to make course corrections. It will affect what your expectation should be for your internal rate of return, particularly in your fixed income investments. If you are assuming a 2% inflation rate a 2% treasury may be appropriate, but if your personal inflation rate is actually 4% (likely from the reasons below) you will have an unaccounted for gap between the rising costs of goods and services and the yield from your chosen investments. This article is a good checklist to make sure that your financial advisor can discuss and will make adjustments for this gaps in inflation math: Your lifestyle No two retirees live the same lifestyle in retirement. If heard other advisors say that, and be able to adjust the product suite they use for risk, or which goals they bake into a plan, or even change the expected costs they use from goal to goal. But then each of them will extrapolate the costs of that lifestyle inflating at 2%. This is a mistake. This shows a lack of understanding as to what causes inflation and the effect it will have on your plan.  Inflation does not affect all products equally, in fact the most impacted items are usually isolated to the items that are purchased by everyone. Groceries, gasoline, and basic services are more impacted by steadily rising costs than that of large ticket consumer goods and electronics.  You may think that this isn’t a big deal right? We all buy groceries and that is a part of my financial plan. This type of thinking is ill-advised and offers a major gap in the calculations and the expectations you should have for your income.  Example: A client of mine said:  “I have a simple life, I don’t buy that many new things, and I’m not all that interested owning new cars, clothes and gadgets in retirement, my calculation for inflation should be pretty low.”  So he wanted me to lower his expected rate of inflation. I said wait a minute, you’re not thinking about that correctly, while yes, he is right that the things he buys may be simple and he’s not going to buy much, he’s wrong about the effect of inflation. Because he’s using the “2% average” he’s heard about he’s missed where the number comes from. The CPI is the change in a basket of goods and services, so it takes into account everything a regular american can reasonably buy (and it doesn’t include gasoline). So in aggregate the number may be 2%, but by not buying those items he’s taking on more, not less, inflation risk for the normal person. See in the chart below where we have eliminated the baskets he didn’t see himself buying (recall that the higher ticket consumer goods generally are disinflationary – the cost of a flat screen TV comes down with time and not up).  Item Annual change in inflation as a Percentage(%) Example clients inflation estimate Groceries +4% +4% Utilities +5% +5% Gasoline +5% +5% Movie Passes +4% +4% Healthcare +6% +6% Automobiles -3% NA Consumer Electronics -3% NA Clothing -2% NA Average 2% 4.8%   So while he is thinking that his appetite for spending is low, his exposure to inflation is more than twice the normal of people in retirement. So when we plan we are trying to extrapolate the costs of a certain lifestyle in retirement, in this scenario the inflation expectation should rise for this client, not fall. More severely, using a standard 2% inflation rate, will cause him to have a shortfall that becomes more complicated as he gets deeper and deeper into retirement.  Declining quality is inflation Several of the items that comprise your quality of life today, deteriorate in quality over time. This is not a hard and fast rule, and in some cases the opposite is true. But if you think about the nature of appliances, automobiles, and other big ticket consumer goods they can become suspect. The refresh cycle for large appliances in the 1990’s was 20% longer than it is for today. This is the result of a few elements, the “smart” revolution and added technology creating more demand for new items, and the decline in their quality. Both of these are measured as disinflationary, the costs of these items have come down year over year, and the “features-scape” is expanding. This all seems disinflationary and in the CPI it’s measured as costs coming down on these items. And while that might be a true statement for someone, the Bureau of Labor Statistics “buys” these items year over year to test the market changes, and for most people this is actually hidden inflation. Here is the math. If the price of an item comes down year over year by say 4%, but the refresh cycle is impacted by anything greater than 4% in a year, the result for regular people is actually inflation, not deflation. Because the

Read More »

Pin It on Pinterest