InSight

Market InSights:

When does a Bear look like a Bull? (Pt. 1)

Four things to avoid and four things to embrace when the Bear turns into a Bull.


A Bear Rally is a short, swift, updraft in stocks that can end as quickly as it began. Here are the four signals to avoid.

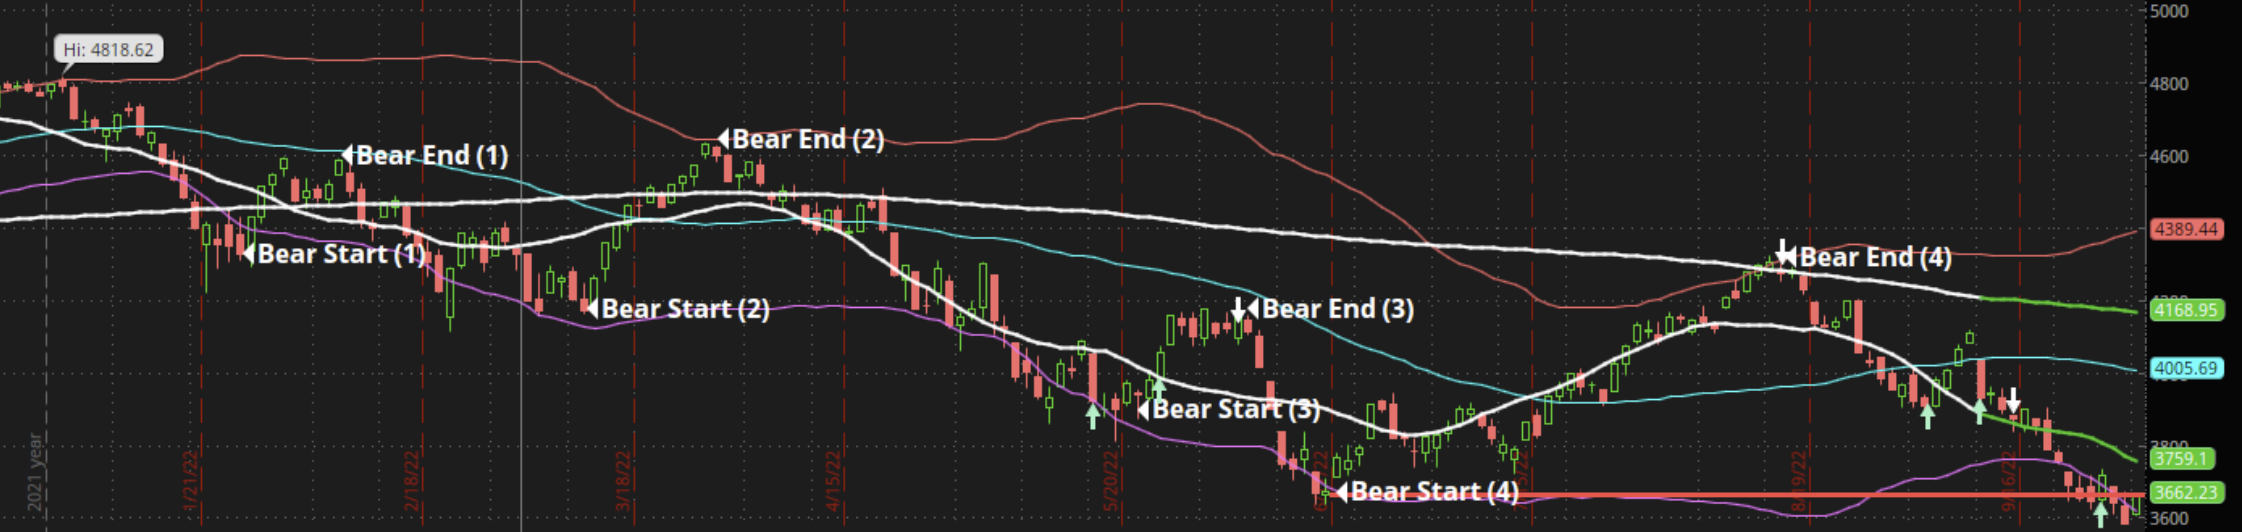
Markets will routinely go through bouts of extreme buying during a bear market. There are several fundamental and technical reasons why markets “rally” at these times amid broader weakness in the market. The market this time has just come off its 4th bear market rally of the 2022 selloff.

Boulder Colorado Investment Management
All Four Bear Rallies

These “false” turnarounds can be frustrating to the casual observer. A feeling that the market is random and chaotic can lead people to become frustrated during these moments of euphoria, only to be quickly rebuffed by another violent selloff.

At some point, these turnarounds stay intact and the Bear market rally is seen for what it is, the beginning of the next bull.

Here are some of the important topics to keep in mind to determine if we are looking at a new Bull, or another Bear.

Markets are Money with Emotion – Bear Rally (4)

If markets were perfectly logical they would be rather dull. If smart people reached the same conclusion regarding the future value of dollars (inflation), corporate revenue (earnings), and cost of capital (debt) then the auction that is the market would see a very narrow band of trading. But, it’s not, there is a maelstrom of emotion that accompanies markets and this market is no exception.

Boulder Colorado Investment Advisor
Bear Market Rally Four

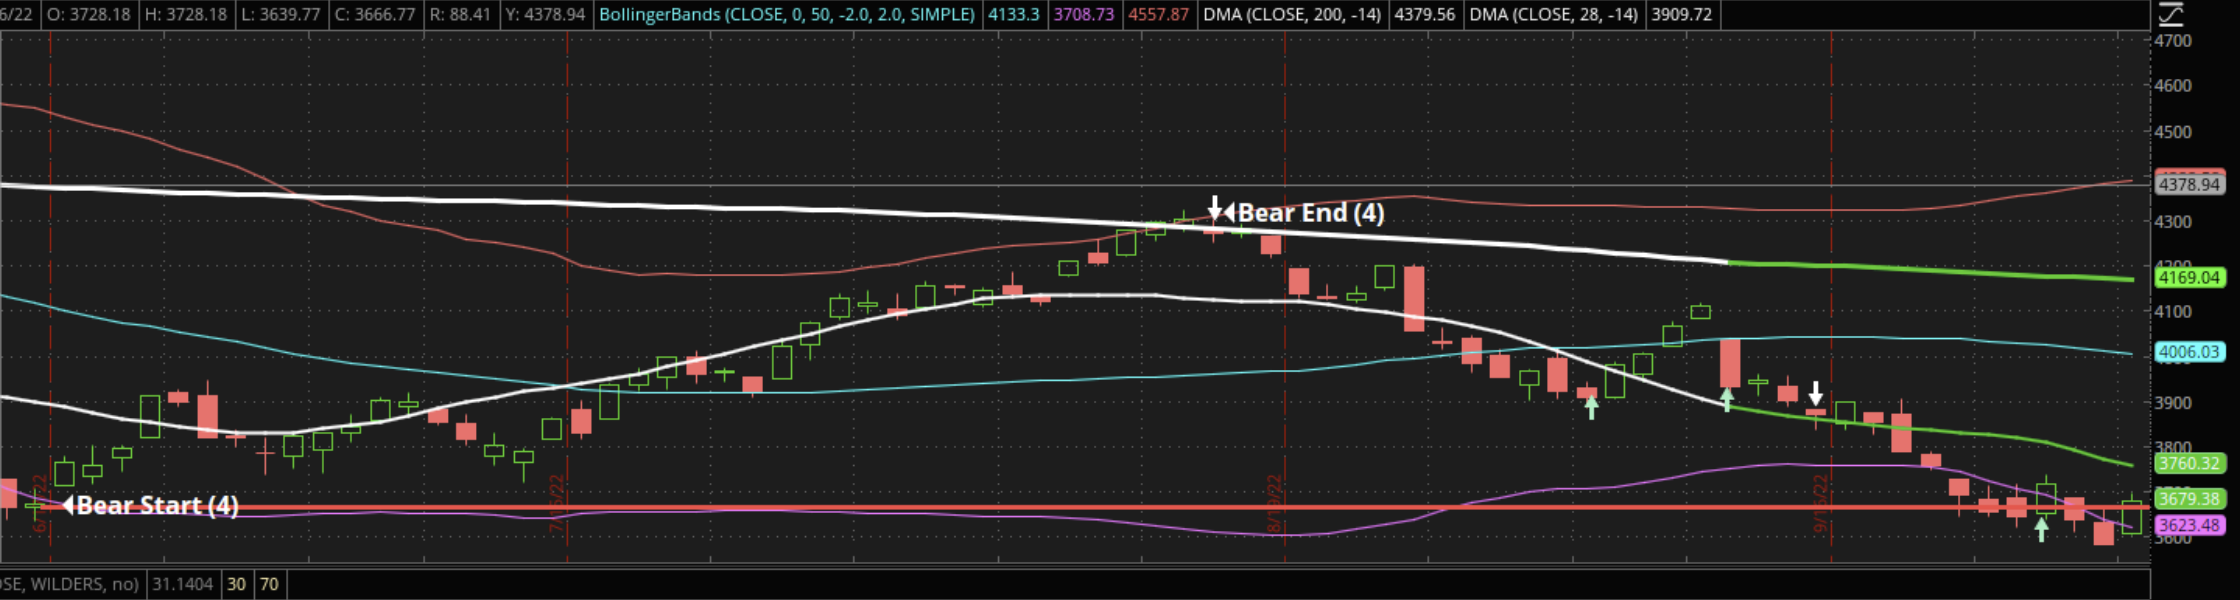
The rally from the June lows, to the most recent selloff, started at the Fed meeting in June and ended in mid-August (Bear Rally 4). The “Dovish Pivot” was the culprit – the belief that a small part of Jerome Powell’s update in June was dovish, and the “feeling” that the rate hiking cycle would come to an end sooner. This was both a fundamental shift in markets and an emotional one. One that we at InSight, didn’t share. We either didn’t hear this new dovishness, or we didn’t believe in it. 

This Bear rally was an abrupt reversal of the trend based on emotion, which you might assume is not a reliable and lasting reason for markets to change course, and you would be right. These good times were quickly brought to an end with more commentary from fed chairs and economists in August and were fully doused by Powell’s speech on September, 21st.

Trading markets on emotions is hard, and for that, we look for momentum to confirm our emotions and use the MACD reading to understand when emotional buying has turned into momentum buying. We try not to fight the momentum in markets.

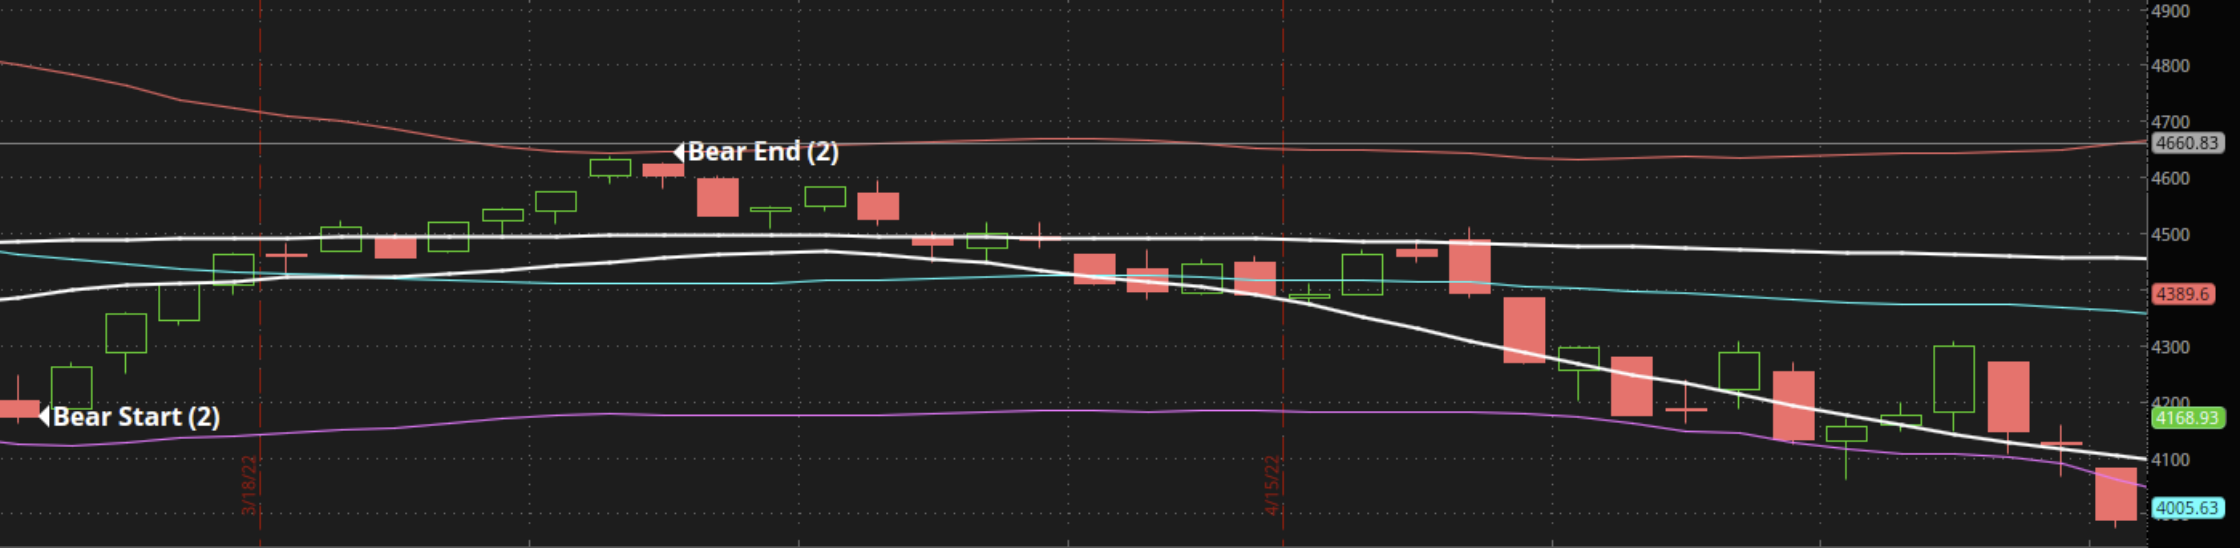
The “Narrow” rally – Bear Rally (2)

When markets turn around, it happens quickly, and no one wants to “miss out” on the bottom. This causes abrupt buying at symbolic (not fundamental) levels or in single stocks or sectors. Some stocks serve as a bellwether for markets, Trains, Chips, and Logistics companies can tell us when the market is healthy and the supply chain orderly. But when one group of stocks march higher alone, it is likely a false rally and they will routinely be brought back with the border market.

The US Technology Index registered a bear market on March 14 when it closed down 19.8% from its peak on Nov. 22. The index then zipped higher, gaining 17.3% as of March 29 before resuming its downward trend. The index lost 27% between its March 29 close and its June 16 low.

boulder financial planning experts expert portfolio management
Bear Market Rally Two

There was a “buy the dip rally” in a Bull Market for well over a decade. So, traders and investors have been conditioned to buy up markets trading on lows. Markets registering short-term (1 and 3 month lows) have been quickly reversed since the financial crisis.

The great financial crisis ushered in an era of seemingly unlimited accommodation from the Fed and every dip was met with more and more liquidity from investors and the government. Operating in unison, the market drawdowns were short, and bull rallies were profitable.

The Bear Rally (2) of this cycle was met with no such injection from the Fed and the rally petered out when traders ran out of money. This reversal was confirmed as the market headed lower from Bear End (2) into Bear Start (3). A lack of dry powder meant there was less capacity to continue buying up the market. 

There was no confirmation in the rest of the market, and it was proof that while technology is the most important sector in the SP500, it alone cannot fix weaknesses in other market sectors.

Oversold conditions cause “snapbacks” – Bear Rally (1)

Beware of Oversold conditions that cause bear-market rallies. This is also known as a bear trap, a sucker’s rally, or a “dead cat bounce.” Frequently bottoms are found when conditions on the Relative Strength Index (RSI) reads “oversold” so traders and investors misinterpret these as bottoms, especially early in a bear market. The Bear Rally (1) is a good example of this:

Boulder Colorado Investment Management
Bear Market Rally One

A phenomenon in bear market rallies is the snapback or dead-back bounce. When stock prices deteriorate so quickly, the oversold conditions are met, and the traders look to profit off the short-lived really to come. Oversold conditions are routinely bought up quickly – but they are quickly reversed when the longer trend catches up with the short-term trend. Oversold, or overbought conditions are usually reached when a chart favors the bias of a daily trend over a weekly trend. 

Rallies based on “oversold” conditions very rarely last longer than a couple of weeks. 6-15 trading days at the most, before the more powerful long-term trend, exerts its pressure over the short term.

More related articles:

Articles
Kevin Taylor

When does a Bear look like a Bull? (Pt. 2)

When will a Bear-Market Rally form a New Bull? The market will turn around, they always do, some would argue that they are built to expand. Below are some of the elements we look for to determine if a market is turning around, or if we are looking at another Bear Rally.  Rallies will get longer in time, and less dramatic  The drama of a bear market is exciting and news outlets love it. The markets and the news gravitate towards those chaotic headlines. This was easily seen when during the last Bull market news outlets ran headlines and talking heads marking the top, declaring market “warnings” and finding economists that would deride the market. It’s exciting and captures eyeballs…the turnaround won’t be all that exciting.  There won’t be a day of major capitulation, followed by a counter move to the upside. It will come with steady, long-term grinds up. It will come with the whole market moving up in a coordinated and cooperative way. Markets with a broad influence from several sectors that grind out small moves over a long time are far more attractive to investors and generate a virtuous cycle.  The Bear Rallies of 2022 so far…   Days Percent Daily % Bear Rally (1) 9 6.1% 0.67% Bear Rally (2) 11 9.9% 0.90% Bear Rally (3) 12 6.2% .51% Bear Rally (4) 41 14.3% .34% Bear Rally (5) ? ? ? The median gain of the largest rallies that have occurred within bear markets is 11.5% over 39 days. Typically, the rallies on the low side of the median, occur early in the bear market, while those that exist on the high side are in the more mature parts of the bear market. Additionally, there are far more rallies below the mean, than above. Meaning that we will see more false rallies that are short and volatile and only a few long-term sustainable rallies that are long with small moves. The longer these rallies get, and the smaller the moves, the more likely an “all clear” can be declared.  There will be broad support   Investment professionals look for certain technical signals to be in place before confirming a reversal is underway. There are several measuring sticks that look for broad support in trading. The advance-decline line, trades above the moving average, and the McClellanOscillator are examples of technical measurements of the breath the market is moving, for how many stocks and how many sectors are participating in the move.  “Breadth thrust” is the term for these signals, and a leading indicator if a market is transitioning from a Bear to a Bull. The duration of the move and the price gains associated with it are also important. The indicators that most reliably confirm that there is a shift into a new bull market are: Flows into equities and out of cash in important ETFs There are “traders” ETFs, and there are “investors” ETFs, and knowing the difference is important. If dollars are flowing into leveraged high volatility trading products it is a signal that the market is trading for a short-term and volatile swing (read a bear rally). If money flows are going into long-term holds that cover the whole of a market in balanced and long-term ways, it’s a signal that the investment appetite is changing to a more long-term outlook and investors are building a new core of their profile. Outsized flows into SPY, QQQ, or VOO are a good sign that the broad market is healthy and investors are willing to hold the whole of the market.  The current market is witnessing the worst first half for stocks and bonds in 50 years, the highest inflation in 40 years, and an endless barrage of bad economic data. So seeing a broad, coordinated shift from cash and cash-like funds, into broad equity will be a good sign in a change from “risk off” to diversified “risk on”. Earrings being “better than expected” at more and more companies There is an entire industry reporting on “beats and misses” on companies’ earnings. While individual stock stories are exciting and reported on the news, the sizes and frequency of misses vs. beats are often overlooked.  Wall Street pros are at odds as to whether we are at an inflection point in the markets. That inflection point will be confirmed when estimates, which are increasingly bleak, are replaced by corporate earnings that are better than expected. This will take several quarters and is a laggard indicator. But is the most reliable measurement to say the companies that make up the market are in a healthy and expansionary space. This seachange in earnings will likely happen 2-3 quarters after the market has “bottomed”, so while not a great trading and timing indicator, it is a very good indicator of changes in the macroenvironment. Company earnings are a more reliable indicator of investment health, this is not a shocking revelation. But the frequency and diversity by which these companies manage inflation pressures, and sell their product to the marketplace is a tide that raises all boats and encourages board participation in rising stock prices.  What past Bear-Markets tell us about future ones A peek at the history of bear markets would suggest that the “naysayers” are on the right side of history, at least for a time. In the 30 different bear markets that have occurred since 1929, the stock market registered an average decline of 29.7%. These downturns lasted have lasted for an average of 341 days. 86% of the bear markets last less than 20 months, and few last longer than one year.   Right now, according to traditional economic interpretations, the U.S. could well be in a recession. We have seen two-quarters of GDP contraction. The Commerce Department reported that gross domestic product shrank by 0.9% in the second quarter of, after contracting 1.6% in the first quarter of this year. That’s it, that is the traditional definition of a recession, and the Bear market has priced

Read More »
Articles
Kevin Taylor

Tariffs, Markets, and Your Wealth: Lessons from History

On Monday, markets received a shock: the U.S. announced new tariffs on goods from China, Canada, and Mexico. The immediate response was a significant market sell-off as investors scrambled to make sense of what the new trade measures would mean for global commerce. But before the day was over, news broke that tariffs on Canada and Mexico would be delayed for a month, offering some temporary relief. Despite this, the market’s reaction was clear—uncertainty around trade policy is unsettling. This isn’t the first time we’ve seen markets respond this way to tariffs. In fact, if history is any guide, the 2018-2019 U.S.-China trade war is the best comparison we have. History may not repeat itself, but it often rhymes. By looking back at what happened during that period, we can better understand what may be coming and how to prepare. The Impact of the 2018-2019 Trade War on the U.S. Economy The tariff war that unfolded between the U.S. and China during 2018 and 2019 caused significant disruptions across industries. Prices for raw materials rose, businesses experienced supply chain bottlenecks, and uncertainty spread like wildfire through corporate boardrooms. As a result, many businesses pulled back on investments and hiring. Economic activity, particularly in the manufacturing sector, slowed. Reports from the Federal Reserve’s Beige Book during that time highlight the ripple effects tariffs had across the economy. Manufacturers reported higher costs and lower profit margins, retailers saw price increases, and contractors noted project delays due to the uncertainty surrounding trade policies. The general mood across industries was cautious, and many firms opted to reduce production and postpone capital expenditures until there was more clarity on trade agreements. This period taught us that protectionist policies like tariffs tend to weigh on growth in the near term. However, these impacts, while significant in the short run, did not permanently derail economic or market performance. How Markets Reacted During the Trade War The 2018-2019 tariff war sent financial markets on a volatile rollercoaster. Stock prices often moved sharply depending on the latest developments in trade negotiations. When talks between the U.S. and China broke down, markets sold off. Conversely, when negotiations resumed or progress was announced, stocks surged. Despite these wild swings, markets ultimately recovered and thrived once there was more certainty. The S&P 500 ended 2018 down 4.38%, weighed down by tariff concerns and a slowing global economy. However, in 2019, following the announcement of the Phase I trade deal between the U.S. and China, the S&P 500 rebounded with a staggering gain of 31.49%. Chinese markets followed a similar pattern of recovery after sharp declines in 2018. What does this teach us? Markets are highly sensitive to uncertainty, especially when it involves global trade. But once clarity is achieved—whether through agreements or a clearer understanding of long-term impacts—markets have historically rebounded strongly. Investors who remained disciplined and avoided knee-jerk reactions during the 2018-2019 trade war were ultimately rewarded. What Today’s Tariff News Means for Investors As we navigate this new round of tariffs, it’s crucial to remember the lessons of the past. Markets are likely to experience heightened volatility in the coming weeks and months as the situation evolves. However, long-term investors should avoid getting caught up in the short-term noise. Instead, focus on maintaining a well-diversified portfolio and keeping your long-term goals in mind. Uncertainty tends to create opportunities for those who can remain patient and strategic. History suggests that today’s tariff concerns may eventually fade into the background once there is more clarity on trade policy. For now, investors should monitor key indicators such as business investment, consumer sentiment, and corporate earnings to gauge how deeply tariffs are affecting the broader economy. Fortunately, there are reasons to remain optimistic. Earnings season has been strong so far, with 77% of S&P 500 companies reporting better-than-expected profits. The blended earnings growth rate for the fourth quarter is tracking at 13.2%, which would mark the strongest year-over-year growth since the end of 2021. These results suggest that, at least for now, U.S. companies are resilient in the face of policy uncertainty. The Role of Central Banks in Navigating Trade Uncertainty Major central banks around the world are also paying close attention to the impact of tariffs on economic growth. Last week, the Bank of Canada and the European Central Bank cut interest rates, citing concerns over slowing economic activity tied to global trade tensions. Both institutions adopted a more dovish stance, signaling that they are prepared to take further action if necessary. In contrast, the Federal Reserve decided to hold interest rates steady for the time being. However, Fed officials emphasized that they remain “data-dependent” and are closely monitoring how tariffs and other policy measures are affecting the U.S. economy. While no immediate rate cuts are expected, the Fed’s cautious stance suggests that it could step in if conditions deteriorate significantly. Inflation, Growth, and the Risks Ahead One of the most common questions we hear is whether tariffs will lead to higher inflation. Historically, tariffs do cause short-term price increases as businesses pass on higher costs to consumers. However, these effects tend to subside once tariffs are removed or supply chains adjust. For this reason, I believe the greater risk is not inflation but slower economic growth. If tariffs remain in place for an extended period, businesses may continue to delay investments, which could weigh on GDP growth. Retaliatory tariffs from other countries could further amplify these risks, creating a drag on global growth. While the U.S. may be better positioned than some of its trading partners to weather a prolonged trade war, the cumulative impact of multiple tariff battles could still take a toll on the domestic economy. Final Thoughts: Staying Calm and Strategic As headlines around tariffs continue to dominate the news cycle, it’s easy to get caught up in fear and uncertainty. However, it’s important to take a step back and look at the bigger picture. Trade tensions are not new, and history shows us that markets are resilient.

Read More »
boulder colorado financial planners
Articles
Kevin Taylor

How to “use” Amortization and why it’s in your K-1?

How to “use” Amortization: Basic Definition: Amortization is a process of spreading out a cost or payment over a period of time. It’s a bit like depreciation, but while depreciation typically refers to spreading out the cost of tangible assets (like machines or buildings) over their useful lives, amortization usually refers to intangible assets like patents, trademarks, or certain loans. Simple Analogy: Imagine you buy a yearly pass to a theme park for $120. Instead of thinking about the cost as $120 all at once, you decide to think about it as $10 per month (since there are 12 months in a year). This monthly perspective helps you understand the cost over time. That’s a very basic idea of how amortization works, though in business, the calculations can be more complex. Amortization in your K-1: What’s a K-1?: Schedule K-1 is a tax form used in the U.S. It represents an individual’s share of income, deductions, credits, etc., from partnerships, S corporations, or certain trusts. If you invest in one of these entities, you receive a K-1 showing your portion of the income or loss. Why Amortization is Relevant: When a partnership (or similar entity) owns intangible assets, those assets may be amortized. This amortization can create a tax deduction for the entity, reducing its taxable income. If you’re an investor in that entity, your share of that deduction would appear on your K-1. This could affect your personal tax return, potentially reducing your taxable income based on your share of the amortized expense. In simple terms, amortization on a K-1 represents your share of a tax benefit from the spreading out of certain costs by the entity you’ve invested in. These are Typical Sources of Amortization in the expenses of an investment: Organization Costs Definition: These are costs associated with forming a corporation, partnership, or limited liability company (LLC). They can include legal fees, state incorporation fees, and costs for organizational meetings. Amortization: These costs are typically amortized (spread out) over a period of 180 months (15 years) starting from the month the business begins operations. Start-up Costs Definition: These are expenses incurred before a business actually begins its main operations. They might include market research, training, advertising, and other pre-opening costs. Amortization: Similar to organization costs, start-up costs are generally amortized over a 15-year period beginning from the month the business officially opens its doors. Loan Fees Definition: These are costs or fees associated with obtaining a loan. Examples include origination fees, processing fees, and underwriting fees. Amortization: Instead of deducting these costs in the year they are incurred, businesses often amortize them over the life of the loan. So, if you paid a fee to obtain a 5-year loan, you’d spread out (amortize) that fee over the 5-year term. Permanent Loan Definition: This typically refers to a long-term loan, often used in real estate to replace a short-term construction loan. A permanent loan can last for decades. Amortization in this context: It often refers to the process of paying off the loan in regular installments over a set period. This is different from the amortization of loan fees. The principal and interest payments on a permanent loan gradually pay down the balance over time. Tax Credit Fees Definition: These fees might be associated with the process of obtaining tax credits for a business. For instance, in some cases, businesses might pay fees to consultants or brokers to secure certain tax credits or incentives. Amortization: The method and period over which these fees are amortized can vary based on specifics, but like loan fees, they’re often spread out over the period in which the associated tax credits are recognized or utilized.  

Read More »

Pin It on Pinterest